Bolt.new Not Working? Fix the 10 Most Common Errors (2026)
Bolt.new turns ideas into working apps in minutes - but when your Bolt.new app is not working, the errors are rarely what they appear to be. The blank preview that looks like a UI glitch is usually a broken environment variable. The Supabase data that saves fine in the editor vanishes in production because of a misconfigured RLS policy. The Stripe integration that worked in test mode silently drops webhooks in production because signature validation is missing.
Bolt.new has grown to 5 million registered users and over 5 million monthly visits (Semrush, March 2026). Most apps work well in the builder. The failures happen at launch - when real users hit the app concurrently and the gap between Bolt's preview environment and production becomes visible.
At AppStuck, we've debugged and completed over 300 Bolt.new projects. The ten errors below are the ones that actually block launches. Each section covers the exact symptom, the real cause, and the specific steps to fix it - including the prompts that work. If you've been through these and the app is still stuck, AppStuck can review your codebase within 24 hours.

Before You Start: 60-Second Triage
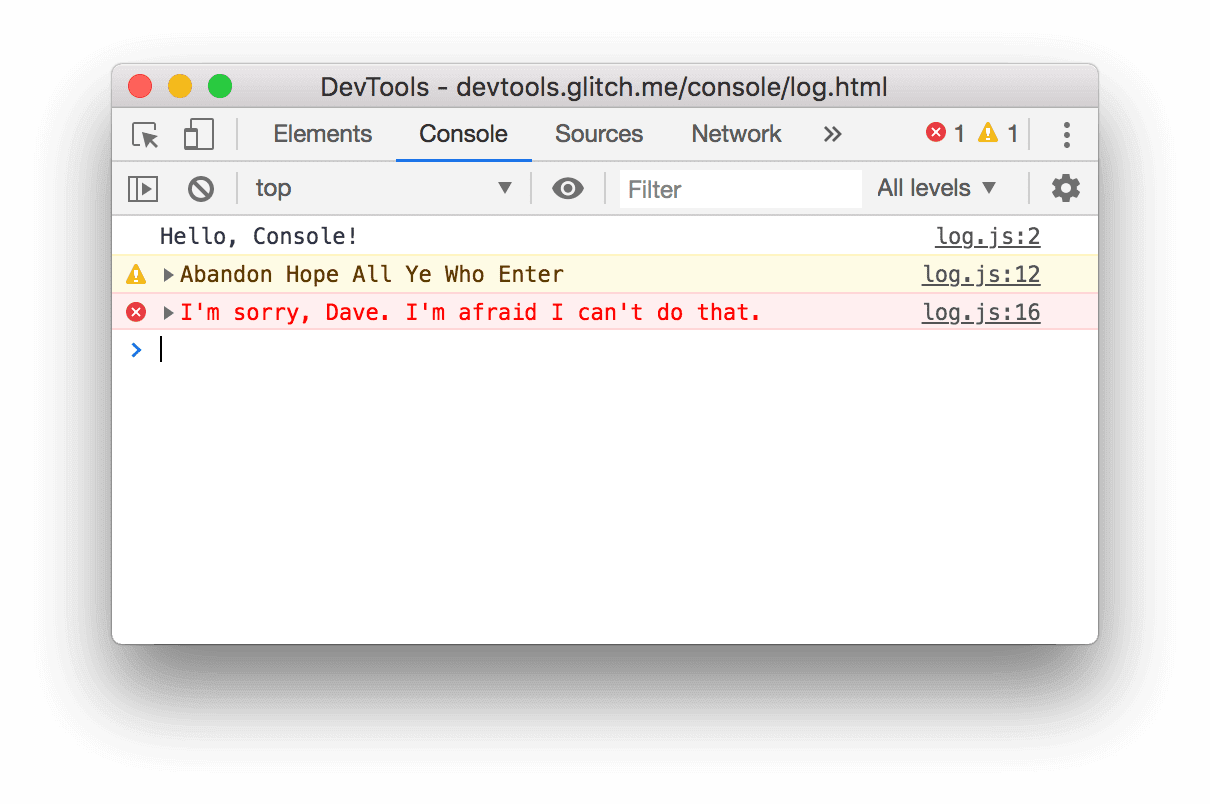
Open your deployed app (not the Bolt.new preview) in incognito mode with DevTools open (F12 on Windows, Cmd+Option+I on Mac). Incognito removes session state and cached assets - errors that only appear to new users won't show in a logged-in browser tab.
Check three panels before anything else:
- Console tab: Any red errors? These tell you which file and line is failing.
- Network tab (Fetch/XHR filter): Any red rows? A 403 points to Supabase RLS. A 401 points to authentication. A 500 points to a backend or edge function failure.
- Application tab → Storage: After logging in, is there a
sb-access-tokencookie on your production domain? If it's missing, your Supabase auth redirect is misconfigured for production.
If you're seeing errors in the Bolt.new preview rather than on your deployed app, the issue is usually in the Bolt.new WebContainer environment itself - errors 1–4 below cover those.
Quick diagnosis - which error is it?
- Blank or grey preview in Bolt editor → Error #1
- "Prompt too long" or AI stops responding → Error #2
- AI keeps trying to fix the same bug → Error #3
- WebContainer won't start → Error #4
- Data not saving / 403 in Network tab → Error #5
- Users get kicked back to login page → Error #6
- Payment succeeds but subscription stays free → Error #7
- Build fails with "Check logs" message → Error #8
- Netlify shows "broken link" on live URL → Error #9
- Project or chat history is gone → Error #10
1. Blank or Grey Preview Screen
What it looks like: The preview pane in Bolt.new shows a white or grey screen. The app was working before the last edit. Refreshing doesn't help.
Why it happens: Three causes in order of frequency: (1) a runtime error in the generated code - a missing import, a React component that throws before rendering; (2) a missing or wrong environment variable that causes the app to crash at initialisation; (3) a WebContainer issue where the dev server started but the app failed to mount.
Fix the blank preview:
- Open DevTools Console in the preview pane. The error message will name the exact file and line. Copy it and prompt Bolt:
"The preview is blank. The console shows this error: [paste error]. Fix it without changing any other functionality."
- If the console is empty, open Bolt's Terminal (bottom panel) and run
npm run build. Build output shows errors that the dev server swallows silently. - If the error mentions an undefined environment variable (
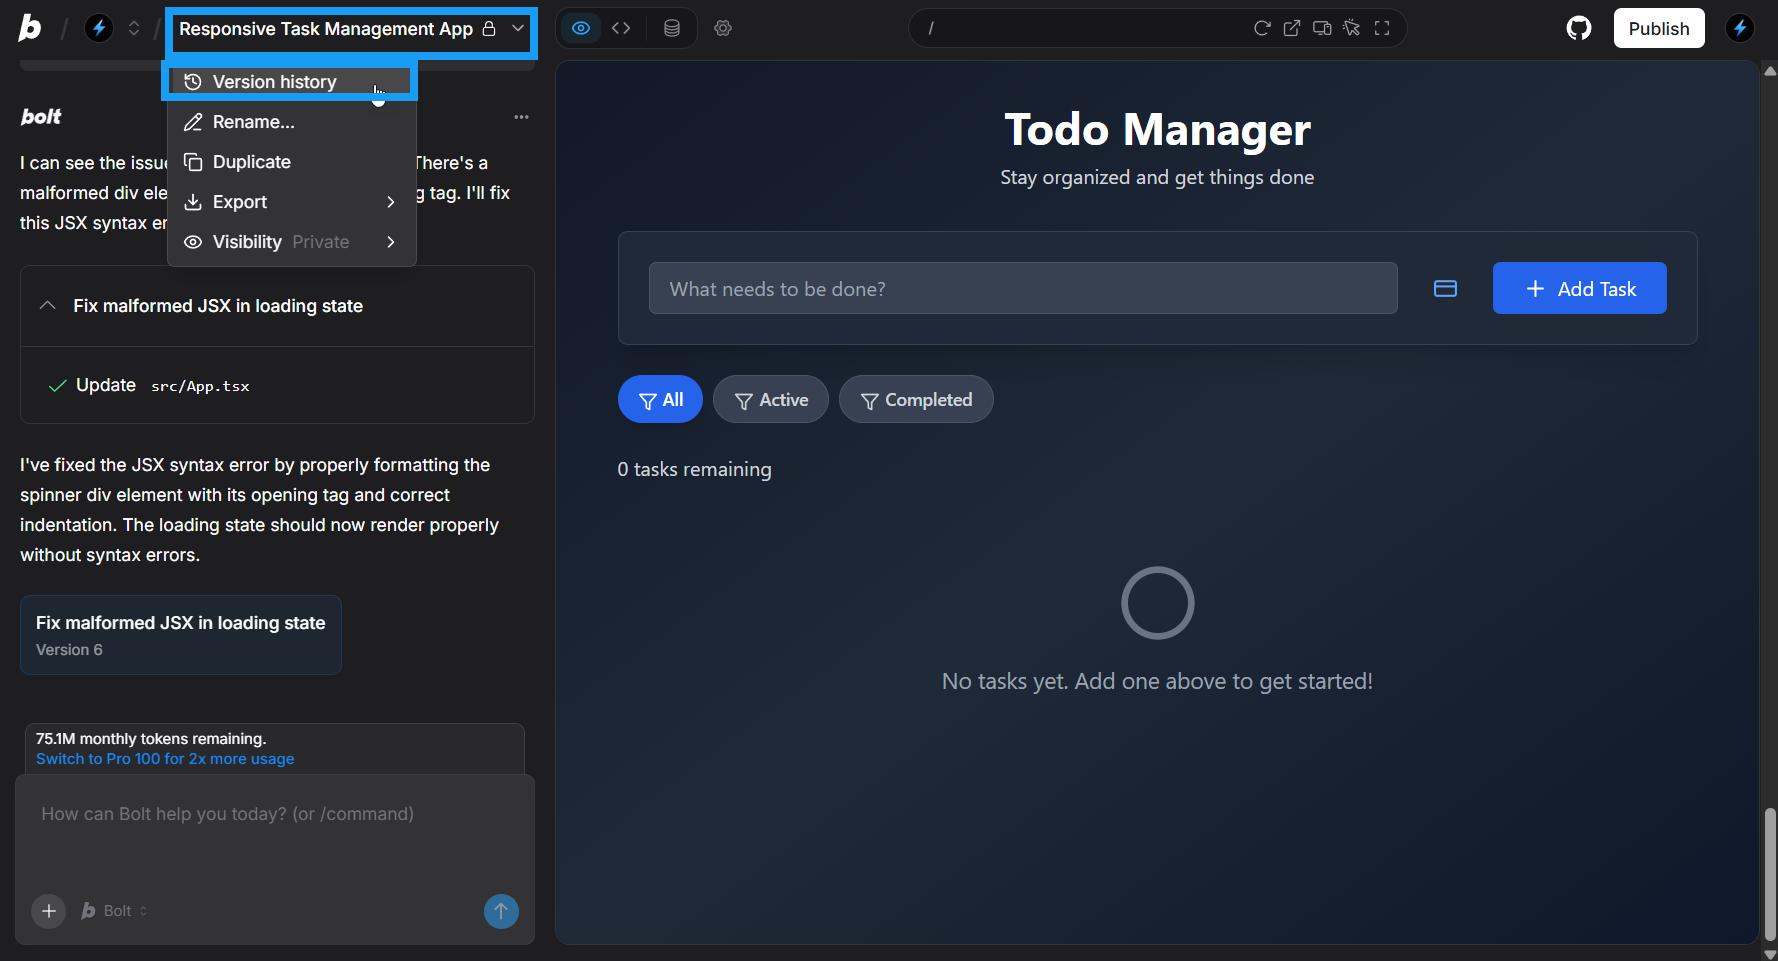
supabaseUrl is not defined,process.env.X is undefined), go to Project Settings → Environment Variables and confirm the key is set correctly. - If you can't identify the cause, open Bolt's Version History: click the project name (top-left) → Version history. Revert to the last commit where the preview was working, then re-apply your change in a smaller, more specific prompt.

- [ ] Console open in preview pane - error message copied
- [ ]
npm run buildrun in Terminal - no build errors - [ ] All environment variables set in Project Settings
- [ ] Version History used to isolate which edit caused the blank
- [ ] Prompt scoped to single fix, not multiple changes at once
When to call an expert: If the blank screen persists after checking the console and reverting, the issue is likely a build pipeline misconfiguration that Bolt's AI can't self-diagnose. A developer can audit the build output and fix it in under an hour.
2. Context Window Exceeded / "Prompt Too Long" Error
What it looks like: Bolt shows a "Prompt too long" or "Project exceeds total supported prompt size" message. Or the AI starts giving incomplete responses - it implements half of what you asked, loses track of earlier decisions, or begins introducing regressions.
Why it happens: Bolt.new has explicit token limits: free accounts get approximately 200,000 tokens, paid accounts approximately 500,000. As your project grows - more files, more code, longer chat history - the AI's active context fills up. When it overflows, the model starts working with a truncated view of your project and makes inconsistent decisions.
Clean up context before it breaks everything:
- Run knip to remove unused files and dead code:
Back up your project first (download ZIP or push to GitHub before running).In Bolt's Terminal:
npx knip --production --fix --allow-remove-files - Split any file over 500 lines. Prompt Bolt:
"Refactor [filename] by splitting it into multiple focused files. Add a comment at the top of each new file explaining its responsibility."
- Create a
.bolt/ignorefile in your project root to exclude files the AI doesn't need to see (test files, docs, generated assets):
Note:tests/*
README.md
docs/*
*.test.ts.bolt/ignoreis being retired on August 3, 2026 for Claude Agent models - check Bolt's documentation for the current equivalent. - Use Discussion Mode (toggle in toolbar) to analyse large areas of the codebase without making changes. Discussion Mode uses a larger context window for analysis only.
- If the AI is already confused and giving inconsistent answers, duplicate the project (creates a fresh chat with the same codebase), then paste a summary of your last working state into the new chat.
- [ ]
npx knip --productionrun and unused files removed - [ ] No single file over 500 lines
- [ ]
.bolt/ignoreconfigured to exclude test files and docs - [ ] Project duplicated if AI is giving inconsistent responses
- [ ] One feature requested per prompt - not multiple changes at once
When to call an expert: Context exhaustion is a signal that the codebase has grown beyond what AI-only iteration can reliably manage. A developer can audit the architecture, refactor the problematic areas properly, and hand back a project that fits cleanly within Bolt's context limits.
3. Token Loop - AI Keeps Trying the Same Fix and Failing
What it looks like: You ask Bolt to fix a bug. It makes a change, introduces a new error. You ask it to fix that. Another change, different error. After 6–8 attempts, the app is in worse shape than before you started, and you've burned through your token allowance.
Why it happens: Each "Try to Fix" attempt adds code without resolving the root cause. Bolt's AI works with the assumption that its last change was correct - so each iteration compounds the confusion. The model's understanding of what the code is supposed to do degrades as the conversation grows.
Break the loop immediately:
- Stop clicking fix. Every attempt makes the context worse and costs tokens.
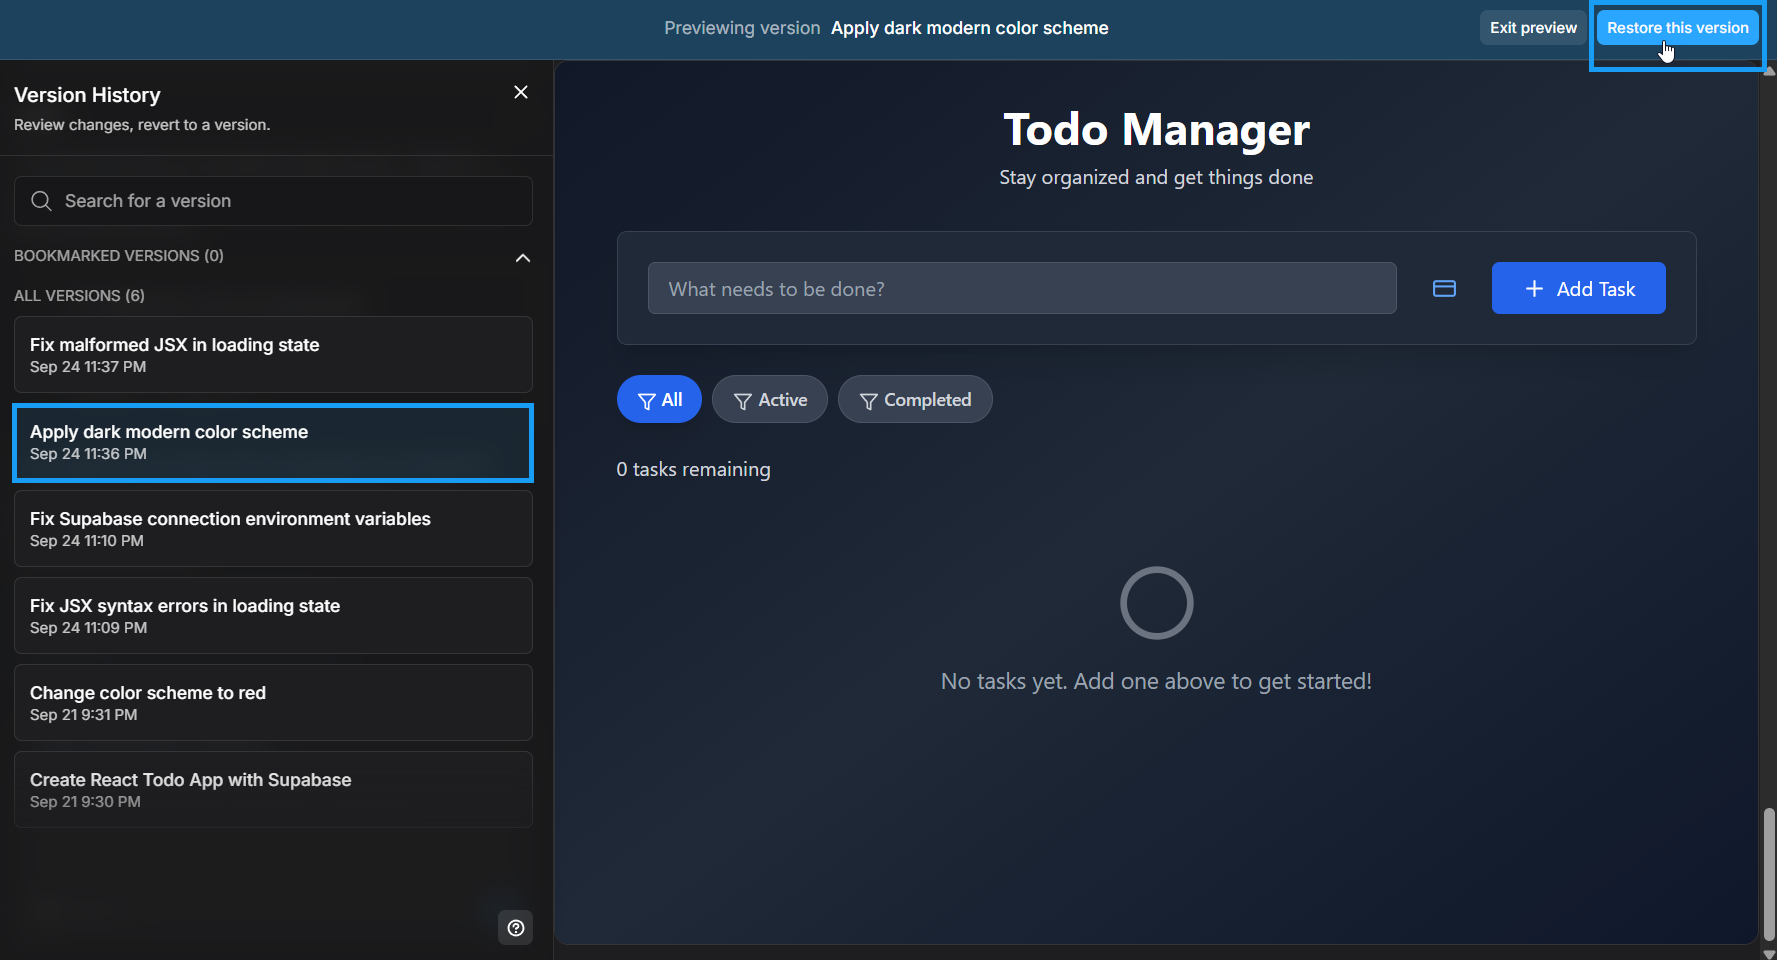
- Open Version History and revert to the last commit where the app was working correctly. Don't try to fix broken state - start from good state.
- Switch to Plan Mode before re-attempting:
"Before making any code changes: explain (1) what you will change, (2) which files you will touch, (3) what the expected result is, and (4) what could go wrong. Wait for my approval."
- Review the plan. If it makes sense, approve. If it doesn't, refine the prompt before any code runs.
- Break the original request into the smallest possible unit. "Add a profile page" instead of "add a profile page with avatar upload, bio, settings, and notification preferences."
- If the AI remains confused after reverting, use the
/clearcommand to wipe the conversation history, or duplicate the project to get a completely fresh context.
- [ ] Maximum 3 fix attempts on the same error before reverting
- [ ] Always revert to working state before re-attempting
- [ ] Plan Mode used before any complex change
- [ ] Request broken into single, verifiable steps
- [ ]
/clearor project duplicate used if AI context seems corrupted
When to call an expert: If you've been through multiple loop cycles and the codebase is now inconsistent, AI-only iteration will continue to make it worse. A developer can assess what the code actually does in 1–2 hours and give you a clean path forward - usually faster than another day of token loops.
4. WebContainer Startup Failure
What it looks like: Bolt.new loads but the preview never starts. You see a spinning indicator that never resolves, or an error banner about the WebContainer failing to initialise. The Terminal may show nothing or a crash immediately on startup.
Why it happens: Bolt.new runs on WebContainers - a browser-based Node.js runtime from StackBlitz. WebContainers require WebAssembly support, which is only reliable in Chromium-based browsers. Browser extensions (especially ad blockers and script blockers), VPNs, and antivirus software that intercepts network traffic all interfere with the WebContainer's network calls. Out-of-memory errors occur when too many Bolt projects or browser tabs are open simultaneously.
Fix WebContainer startup:
- Switch to Chrome or a Chromium-based browser (Arc, Brave, Edge). Firefox and Safari cause inconsistent WebContainer behaviour that is hard to debug.
- Open an Incognito window (no extensions) and try loading your project. If it works in Incognito, a browser extension is the cause - disable them one by one in your normal window.
- Disable VPN and try again. VPNs that intercept WebSocket connections break the WebContainer's runtime communication.
- Close all other Bolt.new tabs and browser tabs you don't need. WebContainers simulate a full Node.js environment in browser memory - running multiple projects simultaneously causes Out of Memory crashes.
- If you see a 403 or 404 error in the Terminal at startup, your antivirus is blocking Bolt's runtime assets. Whitelist
bolt.newandstackblitz.ioin your antivirus, or temporarily disable it to confirm. - Clear browser cache and hard reload (Cmd+Shift+R on Mac, Ctrl+Shift+R on Windows).
- [ ] Using Chrome or Chromium-based browser (not Firefox/Safari)
- [ ] Tested in Incognito (no extensions) - confirmed extensions aren't the cause
- [ ] VPN disabled
- [ ] Only one Bolt project open at a time
- [ ] Antivirus not blocking bolt.new or stackblitz.io
- [ ] Browser cache cleared
When to call an expert: If the WebContainer starts but the app itself crashes on startup (separate from the runtime issue), the problem is in the generated code. A developer can read the build output and fix the root cause directly.
5. Supabase 403 Errors and Data Not Saving
What it looks like: The UI shows a success state - you submit a form, get a confirmation - but nothing appears in the database. Or the Network tab shows a red 403 Forbidden when the app tries to read or write data.
Why it happens: Bolt.new generates Supabase integrations with Row Level Security (RLS) policies that work in the Bolt preview environment but are misconfigured for production. A common pattern: Bolt creates an RLS policy that allows access only to the currently authenticated user, but the app queries all rows without filtering by user ID - the policy blocks the query and returns 403. The other cause is using the service_role key in client-side code: this bypasses RLS entirely in testing, so errors only appear when someone switches to the correct anon key in production.
Fix Supabase 403 errors:
- Open your Supabase project → Table Editor → select the table → Policies tab. Review what policies exist and whether they match how the app actually queries data.
- Temporarily set a policy to "Allow all" on a test table to confirm RLS is the cause (if the 403 disappears, RLS was blocking it). Revert the policy immediately after confirming - never leave "Allow all" in production.
- Prompt Bolt to audit and fix the policies:
"The [table name] table is returning 403 in production. Review the RLS policies and fix them to allow [authenticated users / specific operation] correctly. Show me the exact SQL for the corrected policies."
- Check which Supabase key is being used in the client. Open DevTools → Application → Local Storage. The Supabase client should be initialised with
VITE_SUPABASE_ANON_KEY, not the service role key. If you see the service role key in client-side storage or environment variables prefixed withVITE_, replace it immediately - it gives anyone who inspects the page full database access. - If data is silently not saving (no 403, just no data), ask Bolt to check for unawaited async operations:
"The insert to [table] appears to succeed but no data appears in Supabase. Check for unawaited async calls or missing error handling in the insert logic."

- [ ] RLS policies match the actual query patterns in the code
- [ ]
service_rolekey not present in any client-side code orVITE_env vars - [ ] Supabase client initialised with
VITE_SUPABASE_ANON_KEY - [ ] All inserts/updates awaited correctly (no silent unawaited async)
- [ ] Tested with a non-admin user account to confirm data isolation
When to call an expert: RLS misconfigurations are security vulnerabilities, not just functionality bugs. If your app handles user data, payments, or private content, get a security review before launch. A misconfigured RLS policy can expose every user's data to every other user without triggering any visible error.
Is your Bolt.new app stuck at one of these errors?
AppStuck reviews Bolt.new codebases and gives you a clear fix plan, usually within 24 hours. We've handled pre-launch emergencies, Supabase misconfigurations, and Stripe integration failures across 300+ real projects. See our Bolt.new services page or book a free assessment below.
Get a free codebase assessment6. Auth Loop - Users Get Redirected Back to Login
What it looks like: Users log in and immediately get sent back to the login page. Or the app shows a loading spinner indefinitely after login. The bug doesn't appear in Bolt's preview or when you test it logged in - it only shows up with new users or after deploying to a custom domain.
Why it happens: Bolt.new generates Supabase auth flows configured for the Bolt preview URL. When you deploy to a custom domain, Supabase doesn't recognise the new domain as an allowed redirect target and sends users back to the login page. The second cause is a JWT propagation delay: Bolt's generated auth code sometimes checks the user's session synchronously before Supabase has finished propagating the access token, causing an apparent "not logged in" state that resolves after a refresh.
Fix the auth loop:
- In Supabase: Authentication → URL Configuration. Add your production domain to both the Site URL field and the Redirect URLs list. Add both
https://yourdomain.comandhttps://yourdomain.com/**. - If the URL is correct but the loop persists, prompt Bolt:
"The app redirects users back to the login page immediately after login in production. Fix the auth flow to wait for the Supabase session to fully resolve before checking auth state. Add a loading state while the session is being validated."
- Check that your Supabase project URL and anon key in the deployed environment match the correct Supabase project - not a different project from an earlier prototype.
- Test with a completely new user in an incognito window on the live URL. The loop only affects session initialisation, not existing sessions with cached tokens.
- [ ] Production domain added to Supabase Authentication → URL Configuration
- [ ] Both
https://yourdomain.comandhttps://yourdomain.com/**in Redirect URLs - [ ] Auth flow waits for session resolution before redirecting
- [ ] Supabase URL and anon key match the correct project
- [ ] Tested with a new user in incognito on the live URL
When to call an expert: Auth bugs that affect all new users are high-stakes - they block every signup from converting. If the Supabase URL config looks correct but the loop persists, the issue is in the session management logic and requires a code-level fix.
7. Stripe Webhooks Not Activating - Payments Go Through but Nothing Changes
What it looks like: The payment flow works. Stripe records a successful charge. But the user's account stays on the free plan, the order doesn't get fulfilled, or the database record isn't created. No error appears to the user.
Why it happens: Bolt.new generates Stripe integrations that handle the payment client-side but don't implement signature validation on the webhook endpoint. In test mode, Stripe sends webhook events to your local handler and they work because the check is lenient. In production, Stripe sends the real webhook with a cryptographic signature - if your endpoint doesn't validate it, the request is silently dropped. This is the exact failure pattern in a real pre-launch case we handled: 4 hours 55 minutes before the launch, payments were going through but no database records were being created.
Fix Stripe webhook validation:
- Go to your Stripe Dashboard → Developers → Webhooks. Find your webhook endpoint and copy the webhook signing secret (starts with
whsec_). - Add the signing secret to your production environment variables as
STRIPE_WEBHOOK_SECRET. - Prompt Bolt to add proper validation:
"The Stripe webhook endpoint is receiving events but not processing them in production. Add Stripe signature validation using the STRIPE_WEBHOOK_SECRET environment variable. The raw request body must be used for validation - do not parse it as JSON before validating."
- Add idempotency handling to prevent duplicate processing when Stripe retries:
"After adding signature validation, add idempotency handling using the Stripe event ID - check if the event has already been processed before executing any database operations."
- Test using the Stripe CLI:
stripe listen --forward-to your-endpoint-url. This replays real webhook events to your endpoint and shows the response in real time.
- [ ]
STRIPE_WEBHOOK_SECRETset in production environment variables - [ ] Signature validation implemented using raw request body (not parsed JSON)
- [ ] Idempotency check on Stripe event ID before processing
- [ ] Webhook endpoint returns 200 immediately, then processes async
- [ ] Tested with Stripe CLI forwarding - events confirmed received and processed
- [ ] Stripe Dashboard → Webhooks showing successful deliveries, not failures
When to call an expert: Stripe integration failures in production mean lost revenue with no error visible to the user. If webhook validation is implemented but events are still not processing, the issue is likely in how the edge function handles the request body - a pattern that requires understanding the full request lifecycle.
8. Build or Deployment Fails
What it looks like: You trigger a deployment and get a generic error: "Build failed. Check logs." Or the build succeeds but the deployed app crashes immediately. The preview in Bolt's editor was working fine.
Why it happens: Two causes account for the vast majority of Bolt.new deployment failures. First: environment variables that exist in Bolt's Secrets interface don't automatically transfer to your deployment host (Netlify, Vercel, etc.). The build runs, the app tries to initialise with undefined variables, and crashes with a generic error message that doesn't name the missing key. Second: Bolt generates code with unpinned dependency versions ("react": "^18" instead of "react": "18.3.1"). When a package receives a minor update between your last working build and the current deployment, it can introduce breaking changes the build doesn't catch.
Fix deployment failures:
- Ask Bolt to audit all environment variables:
"List every environment variable this project requires to run in production. For each one, tell me where to find the value - whether it's a Supabase project setting, a Stripe key, or a custom value."
- Add each variable to your deployment host's environment settings before deploying. In Netlify: Site Settings → Environment Variables. In Vercel: Project Settings → Environment Variables.
- Pin all dependency versions to prevent breaking updates:
"Pin all dependencies in package.json to exact version numbers (remove ^ and ~ prefixes) to prevent unexpected updates from breaking builds."
- Verify the build succeeds locally before deploying. In Bolt's Terminal:
npm run build. If it fails here, fix it here - don't push a broken build to production.
- [ ] All environment variables added to Netlify/Vercel - not just Bolt Secrets
- [ ]
npm run buildpasses in Bolt Terminal before deploying - [ ] Dependency versions pinned (no
^or~in package.json) - [ ] Deploy logs reviewed - first error in the log, not last
- [ ] Build tested twice after fixing to confirm it's stable
When to call an expert: If the build fails with a cryptic error after environment variables and dependencies are confirmed correct, the issue is often in how the app is bundled - missing dynamic import handling, incorrect output directory, or a misconfigured framework adapter. These require reading the full Vite or build tool output.
9. Netlify Shows "Broken Link" After Duplicating Project
What it looks like: You duplicated a Bolt.new project (to get a fresh context or create a variant). The original app was deployed on Netlify. The new project deploys, but the live URL shows: "Looks like you've followed a broken link or entered a URL that doesn't exist on this site."
Why it happens: When you duplicate a Bolt.new project, the Netlify integration doesn't automatically transfer. The new project creates a new Netlify site, but the DNS settings, custom domain, and routing configuration from the original site don't carry over. The URL resolves to the new Netlify site, which has none of the routing rules the original had.
Reconnect Netlify after duplicating:
- In the duplicated Bolt project, open the deployment settings and reconnect Netlify via the GitHub integration. This creates a new Netlify site linked to the new project's repository.
- In the Netlify dashboard, find the new site and confirm the correct build settings: build command
npm run build, publish directorydist(orbuilddepending on your framework). - If you're using a custom domain, update the DNS to point to the new Netlify site. In Netlify: Domain Management → add your domain → follow DNS instructions.
- If the app uses client-side routing (React Router, etc.) and all non-root URLs return the same "broken link" error, add a
_redirectsfile to yourpublicfolder:
This tells Netlify to serveContent of
public/_redirects:/* /index.html 200index.htmlfor all routes and let the client-side router handle navigation.
- [ ] Netlify integration reconnected in duplicated project settings
- [ ] Build command and publish directory confirmed correct
- [ ] Custom domain DNS updated to new Netlify site (if applicable)
- [ ]
public/_redirectsfile present for single-page apps with client-side routing - [ ] Environment variables re-added to the new Netlify site
When to call an expert: If the redirect rule is in place but specific routes still return errors, the issue is in the app's routing configuration - the router isn't matching URLs correctly after deployment. This often requires adjusting the base path or route configuration.
10. Project or Chat History Disappeared
What it looks like: You open Bolt.new and your project isn't in the sidebar. Or the chat history is gone but the project appears to exist. Or you're on a different device and can't find recent work.
Why it happens: Bolt.new projects are stored in StackBlitz, not just in your browser. When you access Bolt from a different device, a different browser, or after clearing cookies, the local session loses the reference to the StackBlitz project. The project still exists - it's just not connected to your current session.
Recover a disappeared project:
- Go to stackblitz.com and log in with the same account you use for Bolt.new (same email/GitHub).
- Navigate to Collections → Bolt collection. Your project should appear here.
- Click the project → "Open in bolt.new". This restores the full project with its history.
- If you've been using Bolt with multiple accounts (GitHub login vs email login), the project may be in a different account. Try logging in with the alternative method.
- As a prevention measure: push your Bolt project to a GitHub repository. In Bolt, connect GitHub integration → push to a repo. You can always recreate the Bolt project from the repo even if the project reference is lost.
- [ ] Logged into stackblitz.com with the same account
- [ ] Checked Collections → Bolt collection for the project
- [ ] Tried alternative login method (GitHub vs email)
- [ ] GitHub integration set up to prevent future loss
- [ ] Project ZIP downloaded periodically as backup
When to call an expert: If the project is truly not found in StackBlitz and you don't have a GitHub backup, contact Bolt support with your account email and approximate project creation date. If a GitHub connection was set up at any point, the code history is fully recoverable from there.
When Self-Debugging Stops Making Sense
Most of the errors above are fixable with the steps provided. Some situations signal that continued self-debugging has diminishing returns:
- The same error returns after multiple fix attempts - the root cause hasn't been addressed, only the symptom
- The AI is no longer reliable - giving inconsistent answers, undoing previous fixes, or not following instructions - the context has degraded past the point where it can produce coherent changes
- Security concerns (payment data, health records, private messages) - RLS misconfigurations and missing webhook validation are silent vulnerabilities; professional review before launch is not optional
- Real users are affected - every hour of an auth loop or data not saving has a direct cost in lost signups or damaged user trust
- A deadline exists - if launch delay has a financial cost (investor demo, customers waiting, product announcement), debugging time has a direct dollar value
- The time and tokens already spent exceed what help costs - a 4-hour developer review often costs less than two days of token loops and context resets
For context: in one pre-launch case we handled, three critical Bolt.new bugs (auth breakdown, Stripe webhook failure, missing environment variable in deploy) were identified and fixed in 4 hours 55 minutes. The founder received 380 signups in the first four hours after launch. The issues weren't impossible - they were just faster to fix with someone who had seen the exact pattern before.
If your Bolt.new app is also stuck, our Lovable troubleshooting guide covers the same pattern of errors for Lovable-built apps. The underlying causes (Supabase RLS, env vars, auth redirects) are very similar across AI app builders.
Still stuck after trying these fixes?
AppStuck specialises in rescuing and completing Bolt.new projects. We've debugged every error on this list - and the edge cases that don't make it into guides - across 300+ production codebases. We'll tell you honestly what your project needs and what it costs, before any work starts.
Book a free 30-minute assessmentRelated posts
Need Help with Your AI Project?
If you're dealing with a stuck AI-generated project, we're here to help. Get your free consultation today.
Get Free Consultation